Grafana - The Powerful Open-Source Business Intelligence Tool You Should Be Using
Discover how Grafana, the powerful open-source BI tool, can help your business unlock valuable insights from your data. Learn about Grafana's flexible connectivity, visualization options, and customization capabilities that make it a top choice for modern BI.
Grafana is an open-source data visualization and monitoring platform that has become increasingly popular as a business intelligence (BI) tool. While Grafana was originally designed for monitoring and analyzing time-series data from sources like Prometheus, InfluxDB, and Elasticsearch, its capabilities have expanded significantly over the years.
Today, Grafana can be used as a full-fledged BI solution, allowing you to connect to a wide variety of data sources, build interactive dashboards, and gain valuable insights into your business. Here are some of the key reasons why Grafana is an excellent choice for your BI needs:
1. Flexible Data Connectivity
Grafana supports a wide range of data sources, including SQL databases, NoSQL databases, cloud services, and time-series databases. This means you can easily connect Grafana to your existing data infrastructure and start visualizing and analyzing your data.
2. Powerful Visualization Options
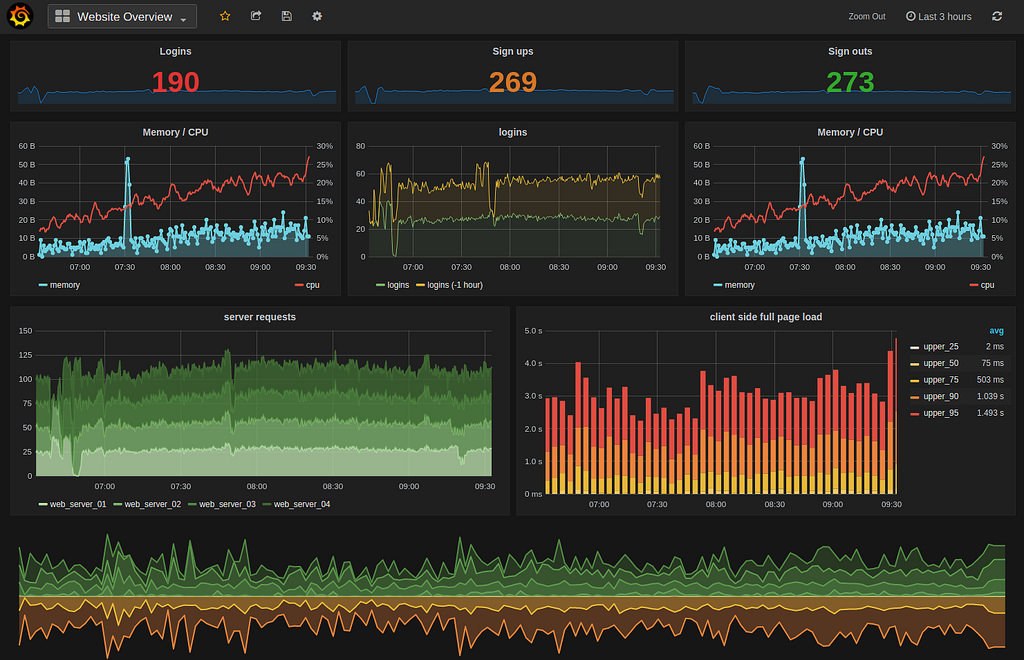
Grafana offers a wide range of visualization options, including graphs, charts, tables, and even geographic maps. You can customize these visualizations to suit your specific needs, and even create complex dashboards that provide a comprehensive view of your business data.
3. Intuitive Dashboard Creation
Grafana's dashboard creation process is straightforward and user-friendly. You can easily drag and drop visualization elements onto the dashboard, and use Grafana's query editor to define the data sources and transformations you want to apply.
4. Collaboration and Sharing
Grafana makes it easy to share your dashboards with others in your organization. You can grant different levels of access to users, allowing them to view, edit, or even create their own dashboards.
5. Alerting and Notifications
Grafana's alerting capabilities allow you to set up custom alerts that notify you when certain thresholds are crossed or when specific events occur. This can be particularly useful for monitoring key business metrics and identifying potential issues before they become major problems.
6. Open-Source and Highly Customizable
As an open-source tool, Grafana is highly customizable and can be extended with a wide range of plugins and integrations. This means you can tailor Grafana to your specific BI needs and integrate it seamlessly with your existing tools and workflows.
Overall, Grafana is a powerful and versatile BI tool that can help you gain valuable insights into your business data. Whether you're a small startup or a large enterprise, Grafana is worth considering as a key part of your BI strategy.
At Nebula, we specialize in helping businesses like yours leverage the power of Grafana and other data-driven technologies to drive growth and improve decision-making. Our team of experienced data engineers, business analysts, and software developers can work with you to design, implement, and optimize a Grafana-based BI solution that meets your unique needs. Contact us today to learn more about how we can help you unlock the full potential of your business data.